

Image Details
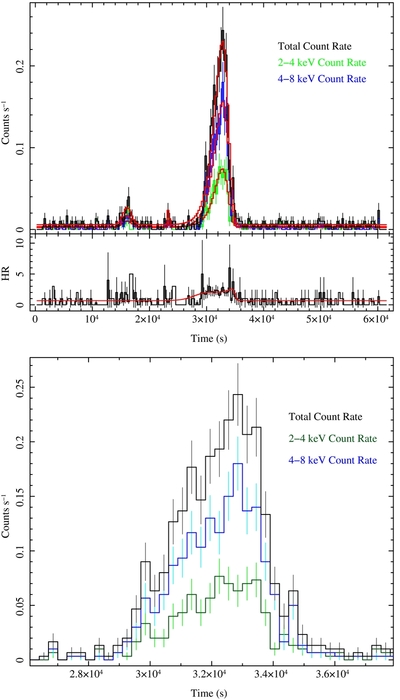
Caption: Figure 1.
Top: 2–8 keV, 2–4 keV, and 4–8 keV Sgr A* light curves in 300 s bins from Chandra ObsID 14392, comprised of zeroth-order and ± first-order counts. Time is measured relative to the observation start: 2012 February 9, 06:17:04 UTC. Each light curve is fit with a constant, two Gaussian distributions (for the precursor flares), and a Gumbel distribution. Middle: hardness ratio of the 4–8 keV/2–4 keV rates, shown with the hardness ratio from the fits. Bottom: close-up of the bright flare, highlighting its asymmetric profile.
Other Images in This Article
Copyright and Terms & Conditions
© 2012. The American Astronomical Society. All rights reserved.

Copyright ©
2026 Astronomy Image Explorer. All Rights Reserved.
