Image Details
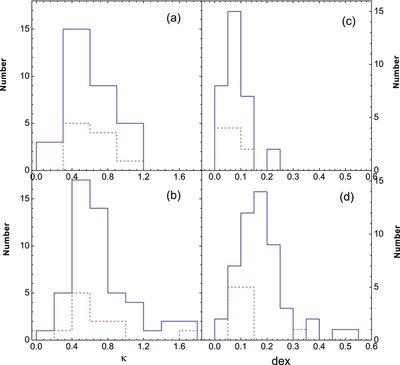
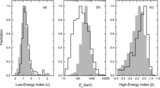
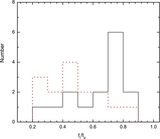
Caption: Figure 8.
Distributions of the correlation power-law index κ ((a), (b)) of the E p − F correlation and the scatter (dex) of data points around the best E p − F correlation ((c), (d)) in the decay phase of the pulses (the first row panels) and for the entire burst (the second row panels). The solid and dashed lines denote the long and short GRBs in our sample, respectively.
Other Images in This Article
Show More
Copyright and Terms & Conditions
© 2012. The American Astronomical Society. All rights reserved.
Copyright ©
2026 Astronomy Image Explorer. All Rights Reserved.