Image Details
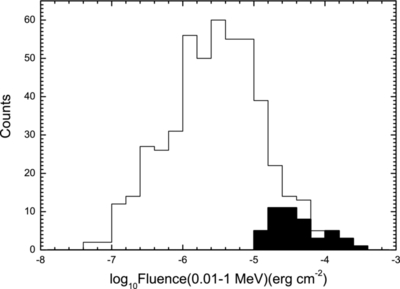
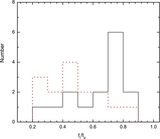
Caption: Figure 1.
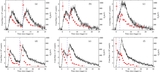
Gamma-ray fluence distribution of the GRBs in our sample (solid histogram) in comparison with that of the first two-year GBM Catalog (open histogram; Paciesas et al. 2012).
Other Images in This Article
Show More
Copyright and Terms & Conditions
© 2012. The American Astronomical Society. All rights reserved.
Copyright ©
2026 Astronomy Image Explorer. All Rights Reserved.