Image Details
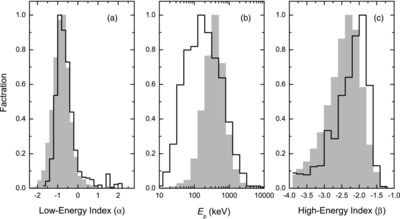
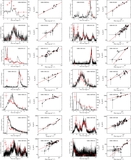
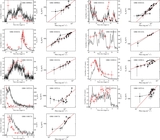
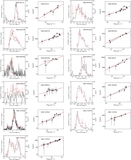
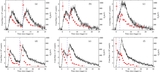
Caption: Figure 4.
Comparison of time-resolved Band spectral parameters, i.e., (a) low-energy spectral index, (b) peak energy, and (c) high-energy spectral index, between the 350 bright CGRO/BATSE GRBs with 8459 time-resolved burst spectra (gray shapes; Data from Kaneko et al. 2006) and the Fermi GRBs included in our sample (solid lines).
Other Images in This Article
Show More
Copyright and Terms & Conditions
© 2012. The American Astronomical Society. All rights reserved.
Copyright ©
2026 Astronomy Image Explorer. All Rights Reserved.