Image Details
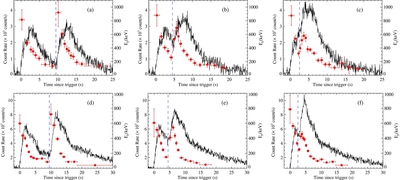
Caption: Figure 6.
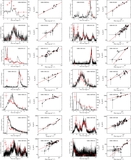
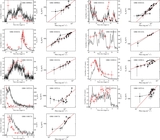
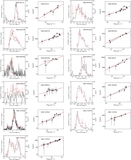
Simulation tests of overlapping hard-to-soft pulses for GRBs 081224 (first row) and 100707A (second row) are taken as a template. The six panels show the Ep-evolution pattern of the simulated GRB with different pulse separations: 10 s (first column), 5 s (second column), 3 s (third column). The vertical dash lines mark the onset of the second pulses. The symbols are the same as in Figure 2.
Other Images in This Article
Show More
Copyright and Terms & Conditions
© 2012. The American Astronomical Society. All rights reserved.
Copyright ©
2026 Astronomy Image Explorer. All Rights Reserved.