Image Details
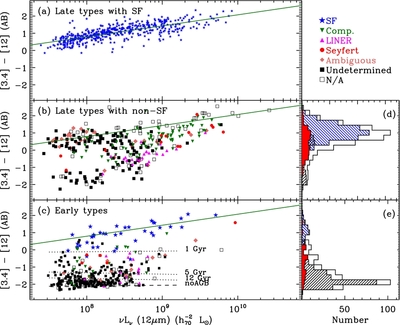
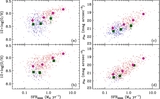
Caption: Figure 13.
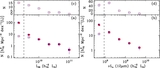
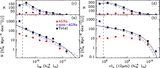
MIR color–luminosity diagrams for late-type galaxies with SF spectral type (a) and with non-SF spectral type (b), and for early-type galaxies (c) in the A2199 supercluster. Different symbols indicate different optical spectral types. Green solid lines are the linear fit to late-type galaxies with star formation. Dotted lines indicate model predictions calculated from the AGB model SSPs (Piovan et al. 2003), assuming a metallicity sequence at three different stellar ages (1, 5, and 12 Gyr), respectively. The horizontal dashed line represents the model SSP without AGB dust. (d) Histograms of MIR colors for late-type, AGN-host (Seyferts, LINERs, and composites) galaxies (red), SF galaxies (hatched one with orientation of 315° (∖∖ with blue colors)), quiescent (undetermined) galaxies (hatched one with orientation of 45° (// with black colors)), and total sample (open one with black colors). (e) Same as (d), but for early-type galaxies.
Other Images in This Article
Show More
Copyright and Terms & Conditions
© 2012. The American Astronomical Society. All rights reserved.