Image Details
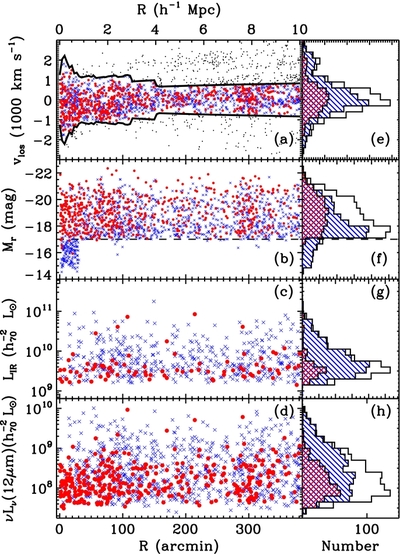
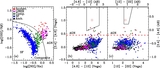
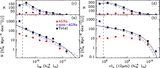
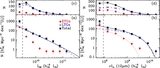
Caption: Figure 3.
Line-of-sight velocity relative to the cluster (a), r-band absolute magnitude (b), TIR luminosity (c), and 12 μm luminosity (d) as a function of clustercentric radius, and their histograms (e–h). We use the mean cluster redshift, cz = 9370 km s −1, determined from the caustic method. Red filled circles and blue crosses indicate early- and late-type member galaxies, respectively. Black dots indicate non-member galaxies. The thick solid line indicates the estimated location of the caustics. Open histogram show the total sample, and early- and late-type galaxies are denoted by hatched histograms with orientation of 45° (// with red colors) and of 315° (∖∖ with blue colors), respectively. The horizontal dashed lines in (b) and (f) indicate the SDSS magnitude limit.
Other Images in This Article
Show More
Copyright and Terms & Conditions
© 2012. The American Astronomical Society. All rights reserved.