Image Details
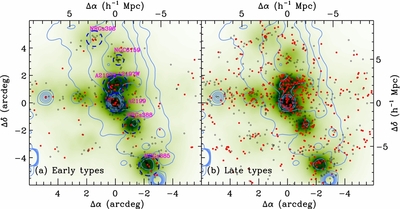
Caption: Figure 4.
Spatial distribution of early-type (left) and late-type (right) galaxies in the A2199 supercluster overlaid on the green and white total galaxy number density maps. Contours with sky-blue color indicate the X-ray intensity map taken from the ROSAT All-Sky Survey, smoothed with a Gaussian filter of σ = 15 arcmin. Galaxies with and without WISE 22 μm detections are denoted by red, filled and black, open symbols, respectively. Dashed circles in (a) represent r 200 of galaxy groups in the A2199 supercluster (Rines et al. 2001, 2002). North is up, and east is to the left.
Other Images in This Article
Show More
Copyright and Terms & Conditions
© 2012. The American Astronomical Society. All rights reserved.
Copyright ©
2025 Astronomy Image Explorer. All Rights Reserved.