Image Details
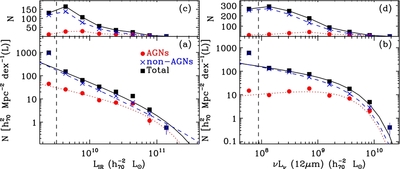
Caption: Figure 9.
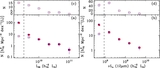
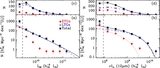
(Bottom) TIR (a) and 12 μm (b) LFs for galaxies in the entire supercluster region (i.e., R < 380′). Circles and crosses are for AGN-host and non-AGN galaxies, respectively, and squares are for the total sample. Dotted and dashed lines are the best-fit Schechter functions for AGN-host and non-AGN galaxies, respectively, and solid line is for the total sample. Vertical dashed lines indicate the luminosity limits at the redshift of A2199 corresponding to 3σ flux limits (3.6 and 0.6 mJy for 22 and 12 μm, respectively). (Top) Number of galaxies used for the construction of the LFs in each bin for TIR (c) and 12 μm (d).
Other Images in This Article
Show More
Copyright and Terms & Conditions
© 2012. The American Astronomical Society. All rights reserved.