Image Details
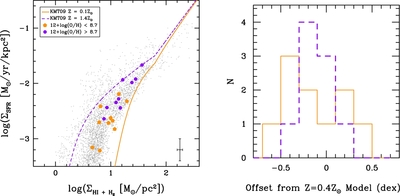
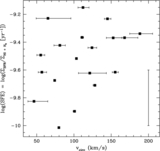
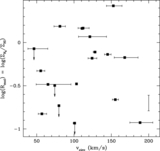
Caption: Figure 12.
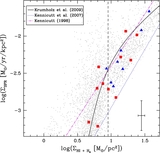
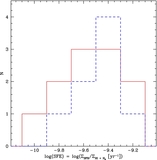
Left: SFR surface density vs. total hydrogen surface density, as in Figure 5, but showing a larger range to demonstrate the model trends. The data are divided by oxygen abundance, where orange pentagons represent galaxies with 12 + log (O/H) < 8.7 and purple circles represent galaxies with 12 + log (O/H) > 8.7. The lines show the Krumholz et al. (2009) model with a metallicity of 0.1 Z ☉ (orange solid) and 1.4 Z ☉ (purple dashed), which corresponds to the lowest and highest metallicities in our sample. Right: histograms of the offset of the data from the Krumholz et al. (2009) model with a metallicity of 0.4 Z ☉. The orange line represents the distribution of galaxies with 12 + log (O/H) < 8.7 and the purple line represents the distribution of galaxies with 12 + log (O/H) > 8.7. There is no significant difference between the distributions.
Other Images in This Article
Show More
Copyright and Terms & Conditions
© 2012. The American Astronomical Society. All rights reserved.