Image Details
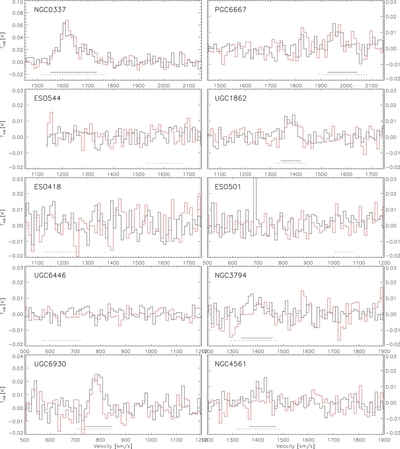
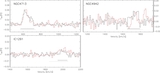
Caption: Figure 1.
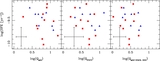
CO(1–0) (black) and CO(2–1) (red) spectra for the objects observed in 2007 May. See Böker et al. (2003) for the remaining spectra. The black horizontal line designates the velocity range over which we integrated to derive the CO(1–0) line intensity. ESO 544-G03, ESO 418-G008, ESO 501-G023, and UGC 6446 do not have this line because they were undetected. The dashed horizontal line is centered on the systemic velocity derived from velocity field modeling of our H i data, and has a width of W 20, which we derived from the integrated H i line profile.
Other Images in This Article
Show More
Copyright and Terms & Conditions
© 2012. The American Astronomical Society. All rights reserved.
Copyright ©
2025 Astronomy Image Explorer. All Rights Reserved.