Image Details
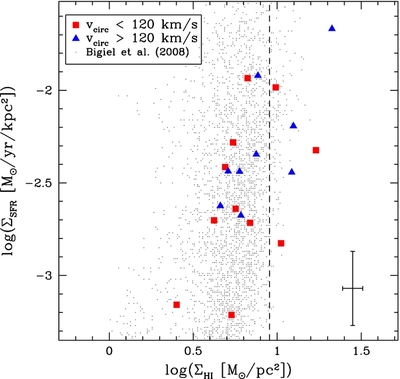
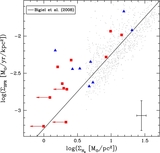
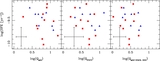
Caption: Figure 3.
SFR surface density vs. atomic hydrogen surface density. Red squares represent galaxies with v circ < 120 km s −1. Blue triangles represent galaxies with v circ > 120 km s −1. The circular velocities are from H i rotation curve fits (Paper I). A representative error bar is shown in the lower right corner (see Sections 3.1 and 3.2 for details). The vertical dashed line is at 9 M ☉ pc −2, the typical maximum density for atomic hydrogen. For comparison, the small black points represent measurements from Bigiel et al. (2008) from seven spiral galaxies sampled at 750 pc resolution.
Other Images in This Article
Show More
Copyright and Terms & Conditions
© 2012. The American Astronomical Society. All rights reserved.