Image Details

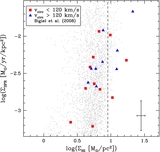
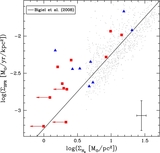
Caption: Figure 5.
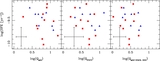
SFR surface density vs. total hydrogen surface density. Symbols are as in Figure 3. The magenta dot-dashed line shows the Kennicutt (1998) fit to a sample of 61 normal spirals and 36 starburst galaxies, where the measurements are averages over the optical disk. The dotted line shows the Kennicutt et al. (2007) fit to M51 data at 520 pc resolution. The solid black line shows the Krumholz et al. (2009) model at 0.4 Z ☉ metallicity.
Other Images in This Article
Show More
Copyright and Terms & Conditions
© 2012. The American Astronomical Society. All rights reserved.
Copyright ©
2025 Astronomy Image Explorer. All Rights Reserved.