Image Details
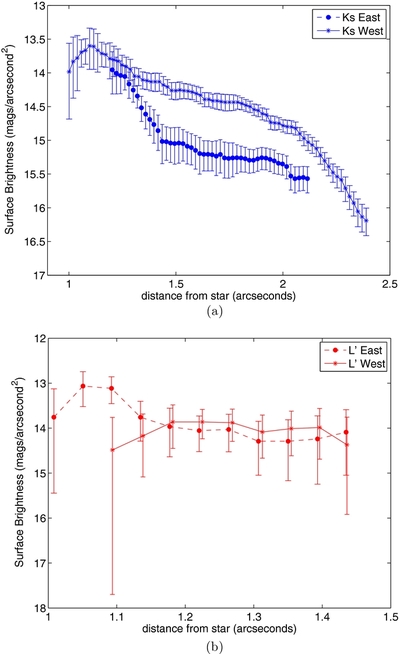
Caption: Figure 5.
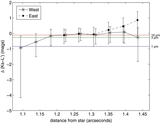
(a) SB profile of the disk at the
Ks band. The western side of the disk is ~a magnitude arcsec
−2 brighter than the eastern side at the
Ks band over the same stellocentric distances. The western SB profile shows a ~2σ drop off in SB near 1''–1
![]() 2. This cannot simply be explained by flux loss due to disk self-subtraction, since this has been corrected for. Note that
the horizontal spacing between data points is 1 pixel (0
2. This cannot simply be explained by flux loss due to disk self-subtraction, since this has been corrected for. Note that
the horizontal spacing between data points is 1 pixel (0
![]() 0194), but the aperture used for the calculations is 0
0194), but the aperture used for the calculations is 0
![]() 15 in radius. (b) SB profile of the disk at
L′. Both sides of the disk are ~equally bright beyond 1
15 in radius. (b) SB profile of the disk at
L′. Both sides of the disk are ~equally bright beyond 1
![]() 2, and just as in the
Ks-band image there is low S/N evidence for a decrease/flattening in SB near 1''–1
2, and just as in the
Ks-band image there is low S/N evidence for a decrease/flattening in SB near 1''–1
![]() 2. Note that the horizontal spacing between data points is 1 pixel (0
2. Note that the horizontal spacing between data points is 1 pixel (0
![]() 0428), but the aperture used for the calculations is 0
0428), but the aperture used for the calculations is 0
![]() 15 in radius.
15 in radius.
Other Images in This Article


Show More
Copyright and Terms & Conditions
© 2012. The American Astronomical Society. All rights reserved.