Image Details
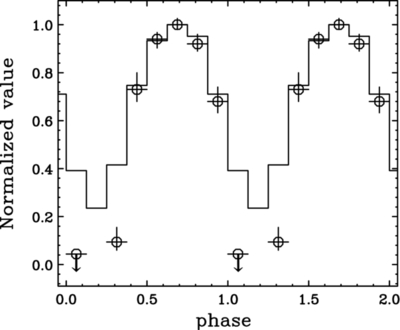
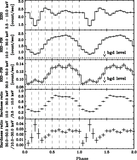
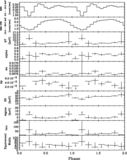
Caption: Figure 14.
Plotted line is the background-subtracted pulse profile in the 10–30 keV energy band. The circles denote the best-fit values of the normalization of the positive power-law term (i.e., the Wien hump) when fitting by NPEX model, presented as a function of the pulse phase (see the text for details). Values are normalized by each maximum value.
Other Images in This Article
Show More
Copyright and Terms & Conditions
© 2012. The American Astronomical Society. All rights reserved.
Copyright ©
2025 Astronomy Image Explorer. All Rights Reserved.