Image Details
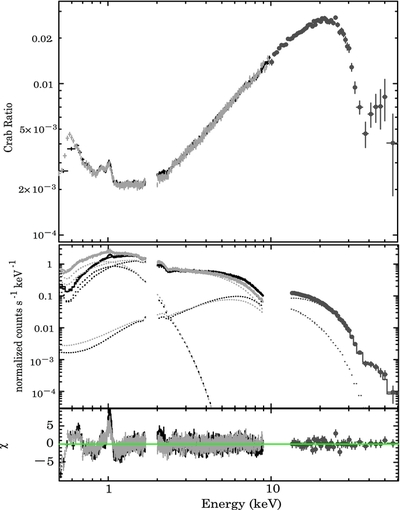
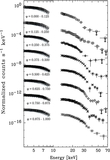
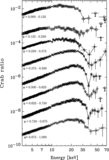
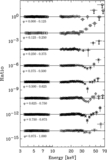
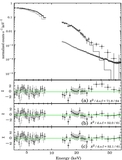
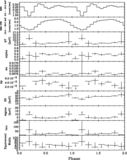
Caption: Figure 2.
Phase-averaged background-subtracted spectra of 4U 1626−67 obtained with Suzaku XIS (black crosses denote XIS-FI data and light gray crosses denote XIS-BI data) and HXD (denoted by circles). Error bars are only for statistical predictions. The top panel shows the raw count rate energy spectra divided by those of the Crab Nebula. The middle panel shows the spectra in counts s −1 keV −1 along with the best-fit models (dotted lines): a blackbody, NPEX with Gaussian-absorption model, and photoelectric absorption (see the text for details). Plots are presented without removal of instrumental responses. The bottom panel shows the residuals between the actual data and the best-fit model.
Other Images in This Article
Show More
Copyright and Terms & Conditions
© 2012. The American Astronomical Society. All rights reserved.