Image Details
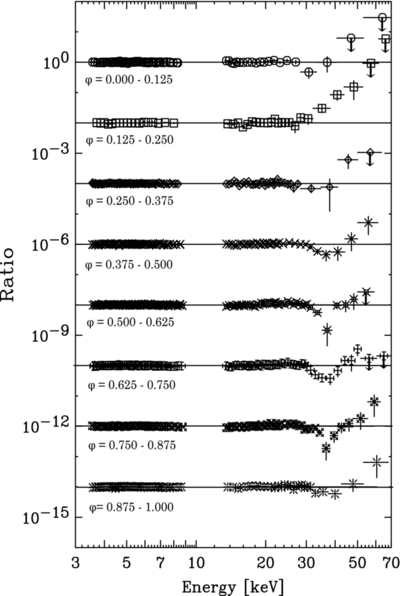
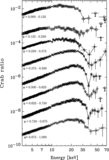
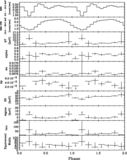
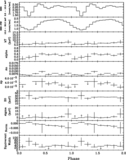
Caption: Figure 7.
Ratios between the data and best-fit NPEX-only model for each phase-resolved spectrum. Phases are indicated in the same manner as Figure 5. Arrows denote the upper limit.
Other Images in This Article
Show More
Copyright and Terms & Conditions
© 2012. The American Astronomical Society. All rights reserved.
Copyright ©
2025 Astronomy Image Explorer. All Rights Reserved.