Image Details
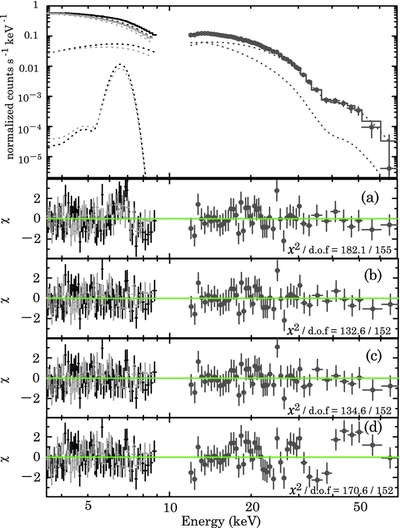
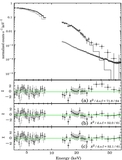
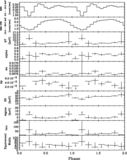
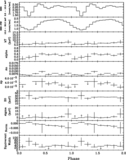
Caption: Figure 3.
Top panel shows the phase-averaged and background-subtracted spectra above 3.5 keV of 4U 1626−67 obtained with Suzaku XIS (FI: black crosses, BI: light gray crosses) and HXD (gray circles). The lower four panels show the residuals in units of standard deviations, χ, from fitting by (a) the NPEX with GABS model without Fe-line emission model, (b) the NPEX with GABS model and Fe-line emission model, (c) the NPEX with CYAB and Fe-line emission model, and (d) the ECUT with GABS model and Fe-line emission model.
Other Images in This Article
Show More
Copyright and Terms & Conditions
© 2012. The American Astronomical Society. All rights reserved.
Copyright ©
2025 Astronomy Image Explorer. All Rights Reserved.