Image Details
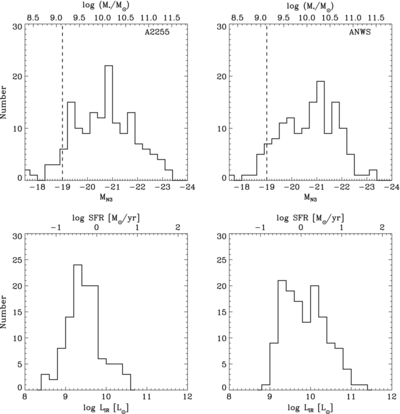
Caption: Figure 10.
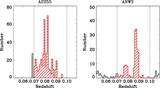
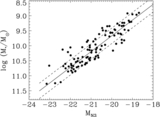
Upper: histogram of the N3 absolute magnitude of galaxies in A2255 (left) and in the ANWS (right). The top axis shows stellar masses calculated from the linear relation in Figure 9. Vertical lines are our N3 magnitude cut. Lower: distribution of derived total IR luminosity L IR (8–1000) for S11-detected galaxies in A2255 (left) and the ANWS (right). The top axis corresponds to SFR, using the Kennicutt (1998) relation.
Other Images in This Article
Show More
Copyright and Terms & Conditions
© 2012. The American Astronomical Society. All rights reserved.
Copyright ©
2025 Astronomy Image Explorer. All Rights Reserved.