Image Details
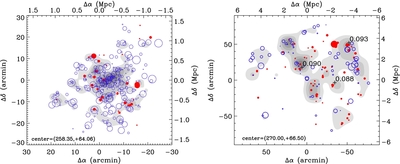
Caption: Figure 12.
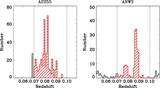
Spatial distribution of galaxies in A2255 (left) and the ANWS (right), on the smoothed galaxy number density map. Red or blue circles represent galaxies with redshifts above or below z = 0.087, respectively. The symbol size is proportional to the redshift deviation from the NEP supercluster mean redshift ( z = 0.087).
Other Images in This Article
Show More
Copyright and Terms & Conditions
© 2012. The American Astronomical Society. All rights reserved.
Copyright ©
2025 Astronomy Image Explorer. All Rights Reserved.