Image Details
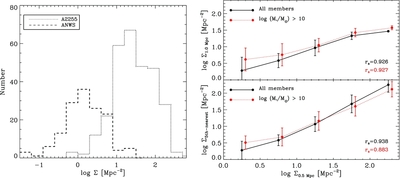
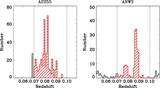
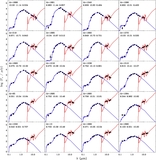
Caption: Figure 11.
Left: distribution of the local density Σ for galaxies in A2255 (dotted line) and in the ANWS (dashed line). Right: comparison
between the local density Σ
0.5 Mpc adopted in this work, which is the number density within a projected distance of 0.5 Mpc, and Σ
1.0 Mpc within a projected distance of 1.0 Mpc (upper) and
 within a projected distance to the 5th-nearest neighbor (lower). The neighbors were identified among all members (black solid
lines) and massive (log
M
*/
M
☉ > 10) ones (red dotted lines) within Δ
v < 1000 km s
−1. The Spearman rank correlation coefficient
r
s
between local densities is printed in the bottom right of each panel.
within a projected distance to the 5th-nearest neighbor (lower). The neighbors were identified among all members (black solid
lines) and massive (log
M
*/
M
☉ > 10) ones (red dotted lines) within Δ
v < 1000 km s
−1. The Spearman rank correlation coefficient
r
s
between local densities is printed in the bottom right of each panel.
Other Images in This Article
Show More
Copyright and Terms & Conditions
© 2012. The American Astronomical Society. All rights reserved.