Image Details
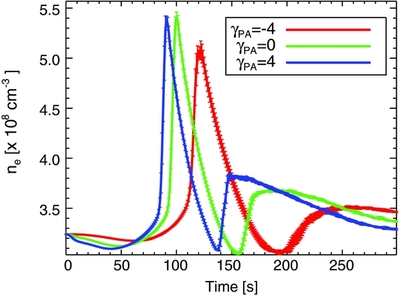
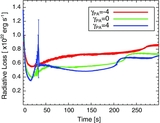
Caption: Figure 10.
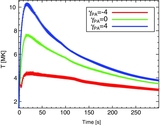
This plot shows the mean thermal electron density at the apex of the loop for the γ PA = −4 (red), γ PA = 0 (green), and γ PA = 4 (blue) cases. The maximum density enhancement of the γ PA = 4 came nearly a minute before the γ PA = −4 case. The error bars denote one standard deviation.
Other Images in This Article

Show More
Copyright and Terms & Conditions
© 2011. The American Astronomical Society. All rights reserved.
Copyright ©
2025 Astronomy Image Explorer. All Rights Reserved.