Image Details
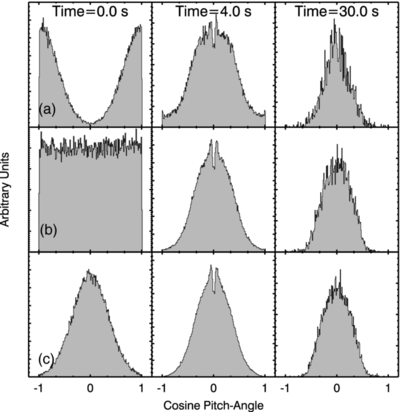
Caption: Figure 16.
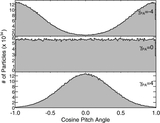
Evolution of pitch-angle distribution as a function of time. Each row corresponds to an initial pitch-angle distribution: (a) γ PA = −4, (b) γ PA = 0, and (c) γ PA = 4 and each plot is scaled to the distribution's maximum at each time. At the beginning of each flare each pitch-angle distribution has its initial shape. However, the γ PA = −4 and γ PA = 0 cases quickly evolve into a ring distribution. Both cases lose the large |cos θ PA| portions of their distribution very quickly. While the total number of particles is dropping in the γ PA = −4, the general shape of the distribution changes very little of the course of the simulation. The humps on either side of cosθ PA = 0 in each simulation are caused by non-thermal particles nearing their mirror point where all of their momentum is perpendicular to the magnetic field. The dips in each simulation at cosθ PA = 0 are caused by the thermalization of the non-thermal particles before they reach their mirror point.
Other Images in This Article

Show More
Copyright and Terms & Conditions
© 2011. The American Astronomical Society. All rights reserved.