Image Details
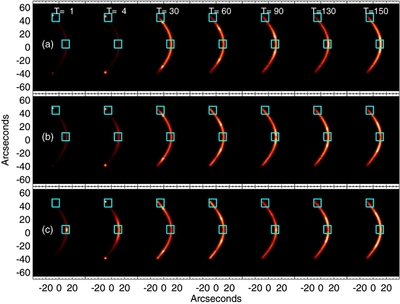
Caption: Figure 11.
Synthesized soft X-ray emission as seen by the XRT medium beryllium filter. Each row corresponds to a pitch-angle distribution: (a) γ PA = −4, (b) γ PA = 0, and (c) γ PA = 4. Each column corresponds to a different time in the simulated flare's evolution, and each image is scaled to its peak emission. Note the initial, bright loop top source in (c). This initial bright source is due to increased apex heating of the γ PA = 4 case resulting in a higher temperature loop.
Other Images in This Article

Show More
Copyright and Terms & Conditions
© 2011. The American Astronomical Society. All rights reserved.
Copyright ©
2025 Astronomy Image Explorer. All Rights Reserved.