Image Details
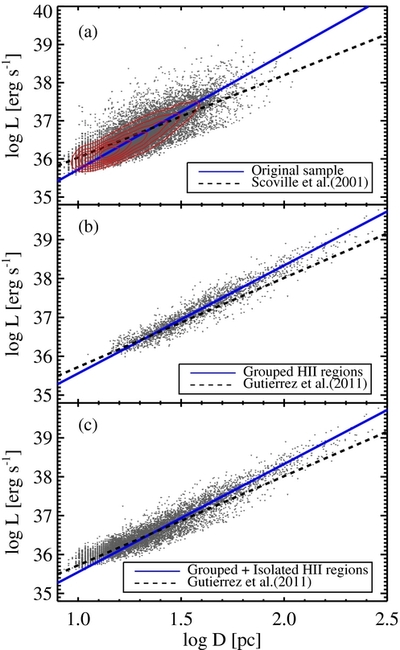
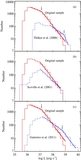
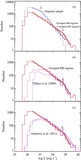
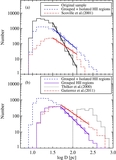
Caption: Figure 12.
(a) The Hα luminosities vs. sizes of the H ii regions in the original sample (dots and contours) and in Scoville et al. (2001, dashed line). Contours represent the number density of H ii regions in the original sample. The solid line represents a power-law fit: L∝ D 3.04 ± 0.01, and the dashed line represents a fit to the data in Scoville et al. (2001): L∝ D 2.16 ± 0.02. (b) The Hα luminosities vs. sizes of the grouped H ii regions (dots) and the H ii regions in Gutierrez et al. (2011, dashed line). The solid line represents a power-law fit: L∝ D 2.78 ± 0.02, and the dashed line represents a fit to the data in Gutierrez et al. (2011): L∝ D 2.29 ± 0.03. (c) The Hα luminosities vs. sizes of the H ii regions in the group sample (dots) and in Gutierrez et al. (2011, dashed line). The solid line represents a power-law fit: L∝ D 2.78 ± 0.01, and the dashed line represents a fit to the data in Gutierrez et al. (2011): L∝ D 2.29 ± 0.03.
Other Images in This Article
Show More
Copyright and Terms & Conditions
© 2011. The American Astronomical Society. All rights reserved.