Image Details
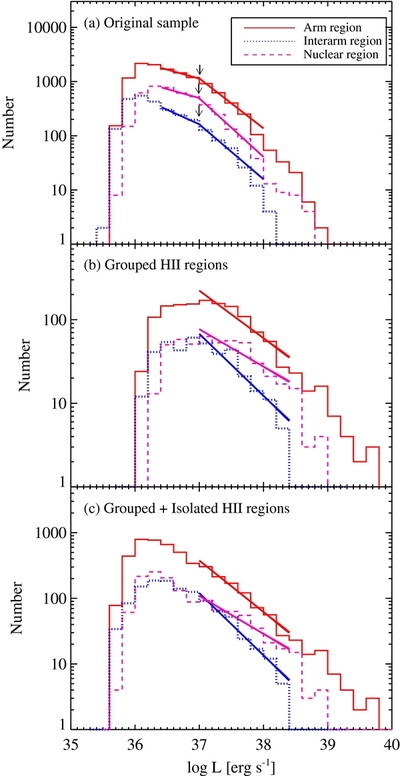
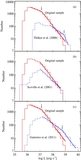
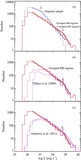
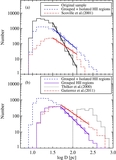
Caption: Figure 6.
(a) The H ii LFs for the arm (solid line), interarm (dotted line), and nuclear (dashed line) regions in the original sample. (b) The H ii LFs for the arm (solid line), interarm (dotted line), and nuclear (dashed line) regions in the grouped H ii regions. (c) The H ii LFs for the arm (solid line), interarm (dotted line), and nuclear (dashed line) regions in the group sample. Thick solid lines represent power-law fits. Arrows mark the break point.
Other Images in This Article
Show More
Copyright and Terms & Conditions
© 2011. The American Astronomical Society. All rights reserved.
Copyright ©
2025 Astronomy Image Explorer. All Rights Reserved.