Image Details
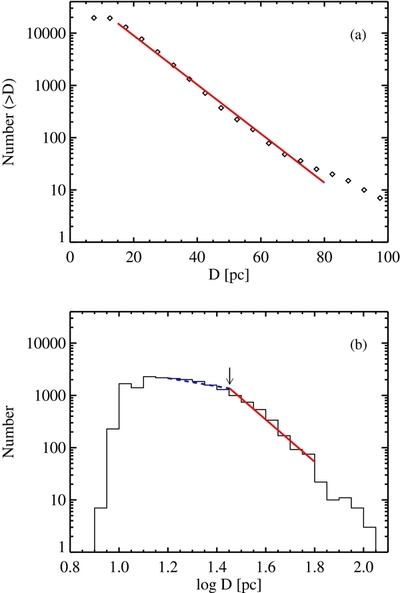
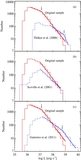
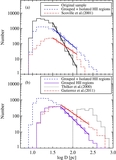
Caption: Figure 7.
Size distribution of the H ii regions in the original sample. (a) Cumulative size distribution. The solid line represents an exponential fit. (b) Differential size distribution. Thick dashed and thick solid lines represent a double power-law fit with a break at log D = 1.45 ( D ≈ 30 pc). The power-law index for small H ii regions with D < 30 pc is α D = −5.04 ± 0.08, whereas α D = −1.78 ± 0.04 for large H ii regions with D > 30 pc. An arrow marks the break point.
Other Images in This Article
Show More
Copyright and Terms & Conditions
© 2011. The American Astronomical Society. All rights reserved.
Copyright ©
2025 Astronomy Image Explorer. All Rights Reserved.