Image Details
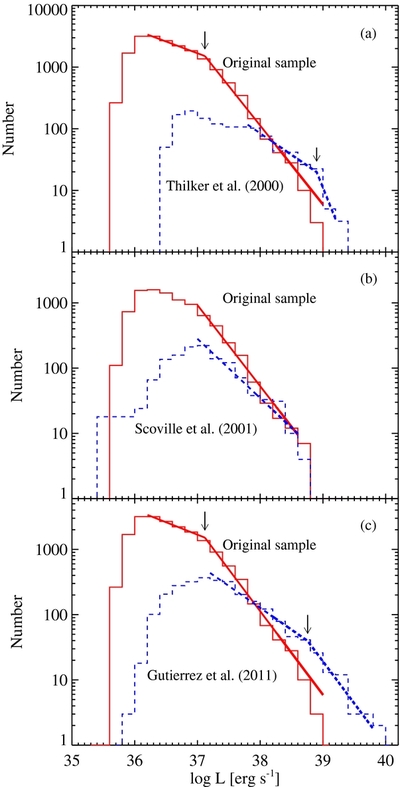
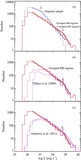
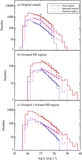
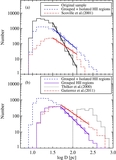
Caption: Figure 4.
Comparison of the H ii LFs for the original sample (solid line) with those in Thilker et al. (2000, dashed line in (a)), in Scoville et al. (2001, dashed line in (b)) and in Gutierrez et al. (2011, dashed line in (c)). Thick lines represent power-law fits. In panels (a) and (c), this study shows a break at L = 10 37.1 erg s −1, while Thilker et al. (2000) and Gutierrez et al. (2011) show a break at L = 10 38.8 erg s −1, much brighter than that in this study. Arrows mark the break point.
Other Images in This Article
Show More
Copyright and Terms & Conditions
© 2011. The American Astronomical Society. All rights reserved.
Copyright ©
2025 Astronomy Image Explorer. All Rights Reserved.