Image Details
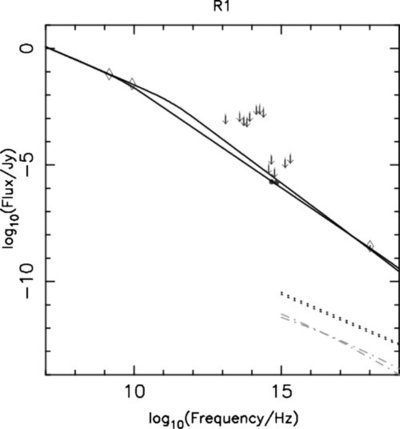
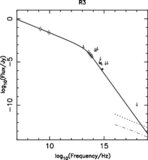
Caption: Figure 8.
Spectrum of the jet in region R1. The diamonds denote the flux densities of the detections, and the arrows the 3σ upper limits for the non-detections. The circles are estimates based on the measurements of Croston et al. (2003). Two representative models of the synchrotron output from broken power-law EEDs are plotted; one in which the break frequency lies just above the 8.4 GHz radio point, and a second in which the break frequency has the largest allowable value given the HST constraints. The predicted IC/CMB and SSC X-ray flux densities assuming equipartition are shown as the dotted and dash-dotted lines, respectively.
Other Images in This Article

Copyright and Terms & Conditions
© 2011. The American Astronomical Society. All rights reserved.