Image Details

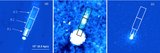
Caption: Figure 1.
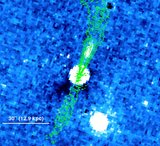
Spitzer IRAC images of the nonstellar emission at 5.8 μm (left) and 8.0 μm (right) in a 1
![]() 5 × 1′ field around the nucleus. The stellar emission was modeled using the 3.6 μm scaled to compensate for zero-point offsets
and aperture corrections. The 3.6 μm emission was color-corrected using a color profile determined for each of the longer
IRAC bands. Jet emission is seen in the region to the north–northwest of the nucleus, both of which are indicated by the red
arrows. The technique used to subtract the stellar emission of NGC 383 results in different residuals of NGC 382 but does
not impact our study of NGC383's jet. The scale bar is 15'' (6.5 deprojected kpc).
5 × 1′ field around the nucleus. The stellar emission was modeled using the 3.6 μm scaled to compensate for zero-point offsets
and aperture corrections. The 3.6 μm emission was color-corrected using a color profile determined for each of the longer
IRAC bands. Jet emission is seen in the region to the north–northwest of the nucleus, both of which are indicated by the red
arrows. The technique used to subtract the stellar emission of NGC 383 results in different residuals of NGC 382 but does
not impact our study of NGC383's jet. The scale bar is 15'' (6.5 deprojected kpc).
Other Images in This Article

Copyright and Terms & Conditions
© 2011. The American Astronomical Society. All rights reserved.