Image Details
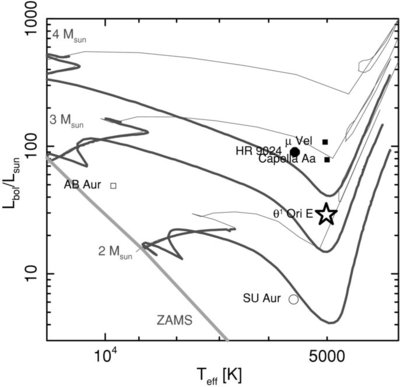
Caption: Figure 6.
Stars listed in Table 7 are shown on a temperature–luminosity diagram. Pre-main-sequence stars are shown with open symbols and post-main-sequence stars are shown as solid symbols. The shapes encode L x / L bol as a "star" for ⩾10 −3, circle for ⩾10 −4 to <10 −3, and a square for <10 −5 (see Table 7 for values). The PMS evolutionary tracks (thick gray lines) and ZAMS are from Siess et al. (2000). The post-main-sequence tracks (thin gray lines) are from Schaller et al. (1992). The tracks are shown for 2 M ☉, 3 M ☉, and 4 M ☉. The post-main-sequence tracks were scaled slightly (0%–3% in temperature, 8%–12% in luminosity) to better coincide with the PMS tracks.)
Other Images in This Article
Copyright and Terms & Conditions
© 2009. The American Astronomical Society. All rights reserved.