Image Details
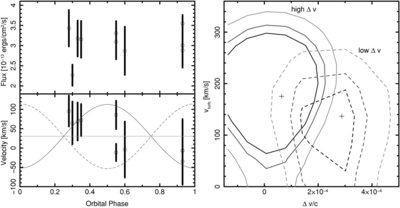
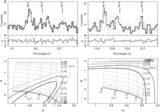
Caption: Figure 2.
Left panel, top: the circles show the mean fluxes of the HEG and MEG spectra over the wavelength range 2–17 Å for each unconfused observation (see Table 1). Error bars show 3σ uncertainties. Left panel, bottom: circles show the measured radial velocities and 90% uncertainties. Stellar component radial velocities (solid and dashed lines in the lower panel) and orbital phases were computed from the ephemeris and orbital solution of Herbig & Griffin (2006). Right panel: χ 2 confidence contours (1σ, 2σ, and 3σ, inner to outer) for Doppler shift (Δ v/ c) against the turbulent broadening parameter. These were computed for two groups of spectra, those nearest the minimum orbital radial velocity separation ("low Δ v": dashed), and those nearest the maximum ("high Δ v": solid).
Other Images in This Article
Copyright and Terms & Conditions
© 2009. The American Astronomical Society. All rights reserved.