Image Details
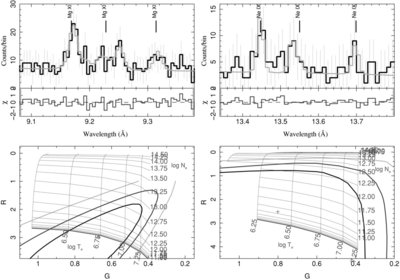
Caption: Figure 5.
Upper plots show the Mg xi (left) and Ne ix (right) triplets counts spectra (black histogram), a multi-Gaussian fit (gray line), and residuals (lower panels of top plots). The positions of the triplet components are marked. The lower plots show the fits to the G (=( f + i)/ r) and R (= f/ i) ratios, which are primarily temperature and density sensitive, respectively, as given by the grid. The contours are the 1σ, 2σ, and 3σ levels from lower/inner to upper/outer contours.
Other Images in This Article
Copyright and Terms & Conditions
© 2009. The American Astronomical Society. All rights reserved.
Copyright ©
2025 Astronomy Image Explorer. All Rights Reserved.