Image Details
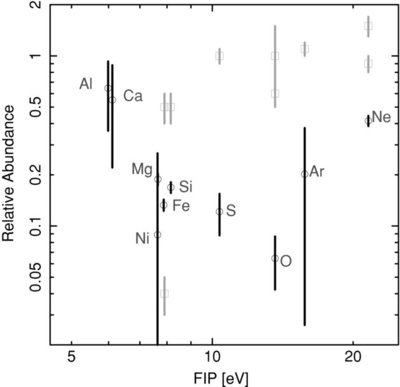
Caption: Figure 4.
θ 1 Ori E abundances (circles) relative to solar photospheric values (Anders & Grevesse 1989) as derived from emission measure reconstruction. Error bars give the statistical 1σ uncertainty. Light colored squares give Orion stellar photospheric (Cunha et al. 1998, 2006; Cunha & Lambert 1994; Cunha & Smith 2005) or nebular (Esteban et al. 2004) abundance ratios for Fe, Si, S, O, Ar, and Ne.
Other Images in This Article
Copyright and Terms & Conditions
© 2009. The American Astronomical Society. All rights reserved.
Copyright ©
2025 Astronomy Image Explorer. All Rights Reserved.