Image Details

Caption: Figure 7.
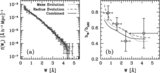
Panel (a): Redshift evolution of the total gas cross section, κ tot = κ g ( R g / R 200) 2, for the best-fit combined model. The black curves represent different halo masses. The key indicated log M for each line type. The two gray curves are the toy model results, discussed in Section 6.2, for log M = 11.0 and 10.5 (upper and lower curves, respectively). Panel (b): Same as panel (a), but results are shown for the 2σ upper limit on κ 1 shown in Figure 5. Gray curves have been shifted up to compare with the halo model results.
Other Images in This Article


Copyright and Terms & Conditions
© 2010. The American Astronomical Society. All rights reserved.
Copyright ©
2025 Astronomy Image Explorer. All Rights Reserved.