Image Details
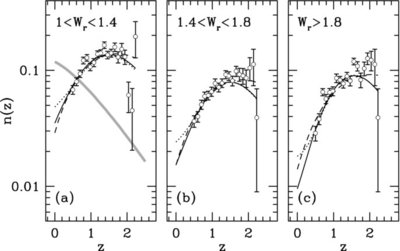
Caption: Figure 1.
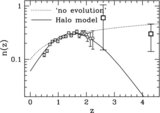
Redshift evolution of absorber counts. Points with error bars represent the measurements of Prochter et al. (2006a) broken into three bins of equivalent width. The dashed and dotted curves represent the radius and mass evolution models, respectively, described in Section 2. The solid curves represent the combined model, discussed in Section 5. The thick gray line in panel (a) shows its evolution of dark matter halo counts for M h >10 11 h −1 M ☉ multiplied by a factor of 0.01 for comparison to the data.
Other Images in This Article


Copyright and Terms & Conditions
© 2010. The American Astronomical Society. All rights reserved.
Copyright ©
2025 Astronomy Image Explorer. All Rights Reserved.