Image Details

Caption: Figure 5.
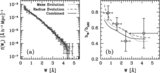
Constraints on the covering factor within R g from the combined model. Inner and outer contours represent models with Δχ 2 < 1 and 4 with respect to the best fit model, respectively. The dashed curve is the best-fit model at z = 0.6, while the dotted curve represents κ g ( M) at z = 2.0. At z = 2, the decrease in κ g above 10 12 h −1 M ☉ has little effect on the Mg ii statistics because the abundance of hot-mode halos is significantly attenuated at this and higher redshifts.
Other Images in This Article


Copyright and Terms & Conditions
© 2010. The American Astronomical Society. All rights reserved.
Copyright ©
2025 Astronomy Image Explorer. All Rights Reserved.