Image Details
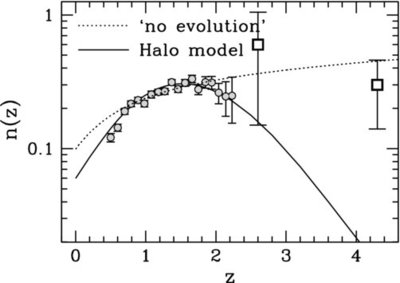
Caption: Figure 6.
n(
z) for the combined evolution model, extrapolated to
z
![]() 4. The circles are the Prochter et al. (2006a) data for
W
r
>1 Å (
z = 2.6) and
W
r
>1.5 Å (
z = 4.3). The squares are the results of Jiang et al. (2007). The dotted line is the "no evolution" model, in which the number
of absorbers per comoving unit distance is constant.
4. The circles are the Prochter et al. (2006a) data for
W
r
>1 Å (
z = 2.6) and
W
r
>1.5 Å (
z = 4.3). The squares are the results of Jiang et al. (2007). The dotted line is the "no evolution" model, in which the number
of absorbers per comoving unit distance is constant.
Other Images in This Article


Copyright and Terms & Conditions
© 2010. The American Astronomical Society. All rights reserved.
Copyright ©
2025 Astronomy Image Explorer. All Rights Reserved.