Image Details
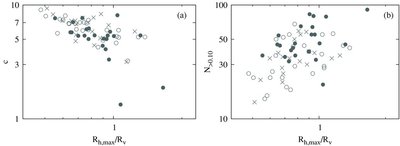
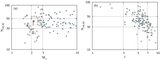
Caption: Figure 8.
( a) Concentration c plotted against the maximum half-mass radius R h,max normalized by the halo virial radius R v (left). ( b) The subhalo abundance N >0.10 plotted against the maximum half-mass radius R h,max normalized by the halo virial radius R v (right). Black circles, white circles, and crosses denote the halos with 2.5 × 10 12 M ☉ ⩽ M < 3 × 10 12 M ☉, 2.0 × 10 12 M ☉ ⩽ M < 2.5 × 10 12 M ☉, and 1.5 × 10 12 M ☉ ⩽ M < 2.0 × 10 12 M ☉, respectively.
Other Images in This Article
Show More
Copyright and Terms & Conditions
© 2009. The American Astronomical Society. All rights reserved.
Copyright ©
2025 Astronomy Image Explorer. All Rights Reserved.