Image Details
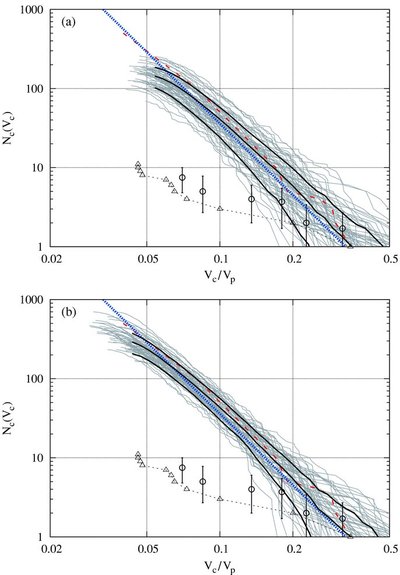
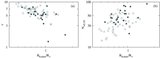
Caption: Figure 2.
Cumulative numbers of subhalos as a function of their maximum rotation velocities V c normalized by those of the parent halos V p. ( a) 68 galaxy-sized halos with 1.5 × 10 12 M ☉ ⩽ M < 3 × 10 12 M ☉ (top). ( b) 57 giant-galaxy-sized halos with 3 × 10 12 M ☉ ⩽ M < 1 × 10 13 M ☉ (bottom). Three thick solid curves show the average (middle) and ±1σ values (top and bottom). Thick dotted and dashed curves are the fitting formula from Diemand et al. (2008) and the result of Moore et al. (1999a) for a galaxy-sized halo, respectively. The thin dashed curve with open triangles denotes the number of dwarf galaxies in our galaxy (Mateo 1998). The open circles with error bars show the number of dwarf galaxies in the Local Group (D'Onghia et al. 2007).
Other Images in This Article
Show More
Copyright and Terms & Conditions
© 2009. The American Astronomical Society. All rights reserved.