Image Details
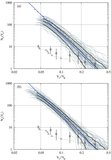
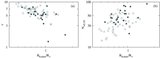
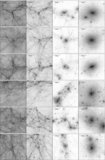
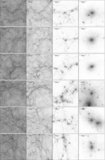
Caption: Figure 7.
Evolution of the halo half-mass radius R h( t). The solid curves show the results of three subhalo-rich halos. The dashed curves show the results of three subhalo-poor halos. The left panel is for halos with 1.5 × 10 12 M ☉ ⩽ M < 2.0 × 10 12 M ☉. The right panel is for halos with 2.0 × 10 12 M ☉ ⩽ M < 2.5 × 10 12 M ☉.
Other Images in This Article
Show More
Copyright and Terms & Conditions
© 2009. The American Astronomical Society. All rights reserved.
Copyright ©
2025 Astronomy Image Explorer. All Rights Reserved.