Image Details
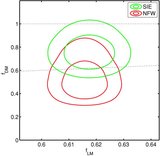
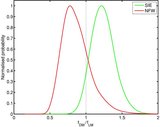
Caption: Figure 6.
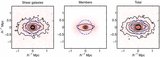
Contours show output axis ratios for simulated misalignments between the light and dark matter. Axes show the input axis ratio f in and standard deviation σ θ (in degrees) of the angle distribution of the simulated clusters.
Other Images in This Article
Copyright and Terms & Conditions
© 2009. The American Astronomical Society. All rights reserved.
Copyright ©
2025 Astronomy Image Explorer. All Rights Reserved.