Image Details
Caption: Figure 1.
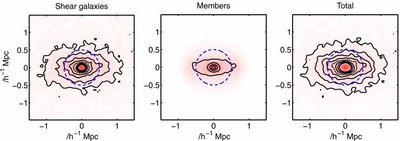
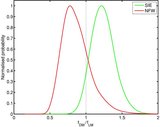
Total number of galaxies per unit area for redshift bin 3 (0.20 < z < 0.25) for illustration. From left to right: shear galaxies, cluster members, and total galaxies (shear galaxies plus cluster members). The left and right panels include galaxies which are uncorrelated with the cluster. We draw our contours relative to the constant background level (which is the same number in both left and right panels, since the cluster member catalogue does not contribute). For the left and right panels, contours are equally spaced from 1.2 to 2.6 times the background level, in steps of 0.2. The dashed contour shows 2 times the background level. For the central panel the contours are 0.2, 0.4, 0.6, 0.8 times the same background level. The dashed circle shows location of mask, see text. For comparison, a 3 × 10 14 h −1 M ☉ cluster at a redshift of 0.2 has R 200 ~ 1.4 h −1 Mpc, where R 200 is the radius within which the mean density of the cluster is 200 times the mean matter density at the cluster redshift. We have zoomed in to show the central part of the postage stamp for clarity.
Other Images in This Article
Copyright and Terms & Conditions
© 2009. The American Astronomical Society. All rights reserved.