Image Details
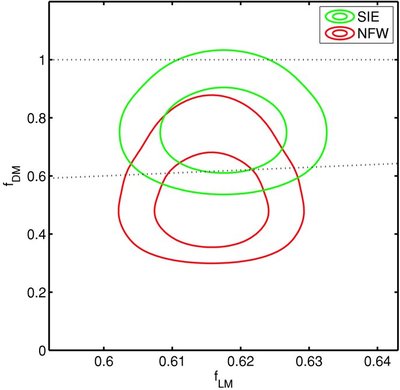
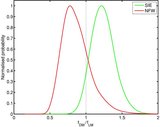
Caption: Figure 4.
68% and 95% contours of the two-dimensional probability distribution for the axis ratio of the dark matter ( f DM) vs. the axis ratio of the total galaxy number density distribution ( f LM, representing the light matter). Light (green) contours show the result from using an SIE profile as modeling the cluster, and dark (red) contours show result from using an NFW profile. The horizontal dotted line shows f DM = 1, and the dotted line rising towards the right shows f DM = f LM.
Other Images in This Article
Copyright and Terms & Conditions
© 2009. The American Astronomical Society. All rights reserved.
Copyright ©
2025 Astronomy Image Explorer. All Rights Reserved.