Image Details
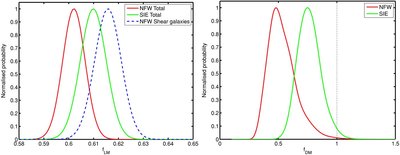
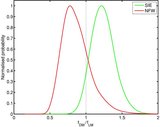
Caption: Figure 3.
Left panel: relative probability distribution of the axis ratio f LM = b/ a for the galaxy number density map from the shear catalogue plus member catalogue, thus including all cluster members. This includes clusters at all redshifts for an NFW model (dark, red line) and an SIE model (light, green line). The dashed line shows the result from shear catalogue galaxies only (for an NFW model). Right panel: relative probability distribution for the dark matter axis ratio f DM. The dark, red line shows result from the NFW model, and the light, green line shows result from the SIE model. The dotted vertical line shows f DM = 1 corresponding to a circular distribution.
Other Images in This Article
Copyright and Terms & Conditions
© 2009. The American Astronomical Society. All rights reserved.