Image Details
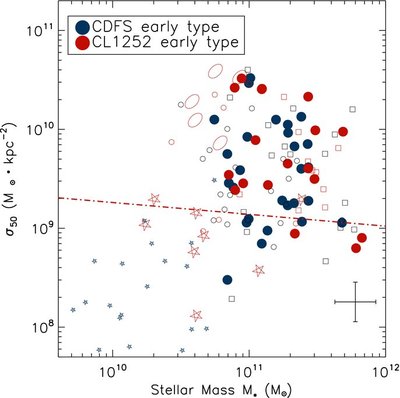
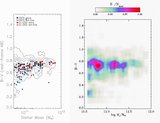
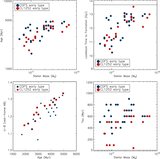
Caption: Figure 7.
Stellar mass vs. the average surface mass density within the half-light radius for the ETG in the cluster (filled red circles) and in the field (filled blue circles). For comparison, we overplot z ~ 2.5 quiescent DRGs (qDRGs; open red ellipses), star-forming DRGs (sDRGs; open red stars), LBGs (filled blue stars) from Zirm et al. (2007) paper. Other samples of 1.0 ≲ z ≲ 1.5 ETG are also drawn from the works of (Trujillo et al. 2006; open red squares), (Daddi et al. 2005; open red circles), van der Wel et al. 2006; open black circles), and (Rettura et al. 2006; open black squares). The red dotted-dashed line represents the local relation for ETG in SDSS calculated from the mass–size relation of Shen et al. (2003). The error bar in the bottom right is representative of the typical uncertainties of our measurements.
Other Images in This Article
Copyright and Terms & Conditions
© 2010. The American Astronomical Society. All rights reserved.