Image Details
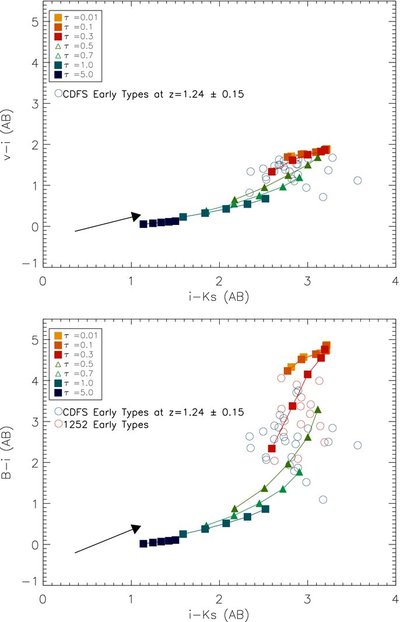
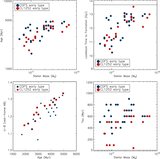
Caption: Figure 2.
Top panel: i − K s vs. V− i color–color plot of BC03 CSP models at z = 1.24 superimposed on our GOODS ETG photometry at z = 1.24 ± 0.15 in blue circles. The squares account for SFHs with various τ models. The grids are drawn for seven different τ's and five ages (2, 2.5, 3, 3.5, and 4 Gyr): the colored lines represent iso-metallicity colors of Z ☉. The black arrow indicates an extinction of E( B − V) = 0.2 as parameterized with the reddening curve of (Cardelli et al. 1989). Bottom left panel: i − K s vs. B− i color–color diagram of the same models and data: B band (λ rest ~ 2000 Å) is mandatory to break the age–SFH degeneracy at z = 1.24.
Other Images in This Article
Copyright and Terms & Conditions
© 2010. The American Astronomical Society. All rights reserved.