Image Details
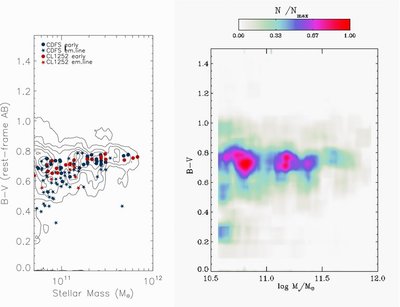
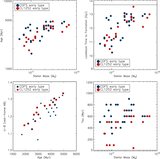
Caption: Figure 4.
B−
V color vs. stellar mass diagram of the observed samples of cluster and field galaxies (left panel: symbols are the same as
in Figure
3) with overplotted contours obtained with the models of Menci et al. (2008; right panel) for galaxies in clusters; the color
code represents the abundance of galaxies in a given (
 ) bin.
Other Images in This Article
Copyright and Terms & Conditions
© 2010. The American Astronomical Society. All rights reserved.
Copyright ©
2026 Astronomy Image Explorer. All Rights Reserved.