Image Details
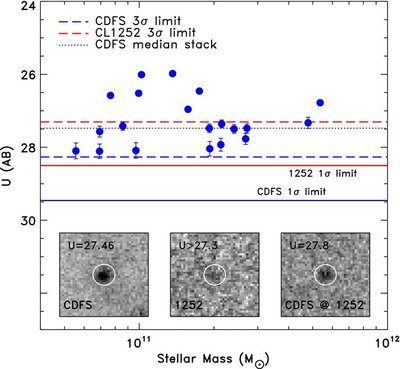
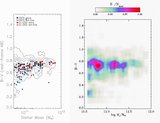
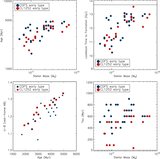
Caption: Figure 10.
Stellar mass vs. U-band-observed magnitude (rest-frame ~1700 Å) for the ETG detected in the field (filled blue circles). Solid lines represent the 1σ (1'' radius aperture) limiting magnitudes of our data sets respectively (blue for the field, red for the cluster). Dashed lines represent the 3σ limits. The blue dotted line indicates the observed magnitude of the median stack of the field ETG U-band images. An image of the median stack of the field ETG U-band observations is displayed in the bottom left corner. The median stack of the cluster ones is shown in the middle. The image at the bottom right corner shows instead the CDFS stack, simulated in the actual CL1252 data (see the text for more details).
Other Images in This Article
Copyright and Terms & Conditions
© 2010. The American Astronomical Society. All rights reserved.