Image Details
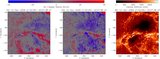
Caption: Figure 5.
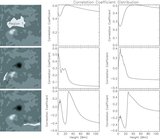
Correlation heights vs. log T max for Regions 1–3. The magnetic field is extrapolated with the NLFFF model except for the top right panel, in which the potential field model is used. The dotted lines are the linear fitting of the height–log T max relationship.
Other Images in This Article
Copyright and Terms & Conditions
© 2009. The American Astronomical Society. All rights reserved.
Copyright ©
2025 Astronomy Image Explorer. All Rights Reserved.